Charting
Our charts are purpose-built to facilitate the discovery of significant relationships between assets and a very large number of potentially relevant indicators and subindicators.
Quick Charts
Charting
Indicators
The diverse range of indicators available necessitates their classification into groups according to their usage, data source or method of calculation. For example, the standard indicators group includes traditional technical indicators, which are typically derived from an asset's price or volume, while intermarket indicators, as the name suggests, are calculated from other possibly correlated assets. Other indicator groups include those with broader objectives, such as breadth indicators, put/call ratios and volatility.
Subindicators
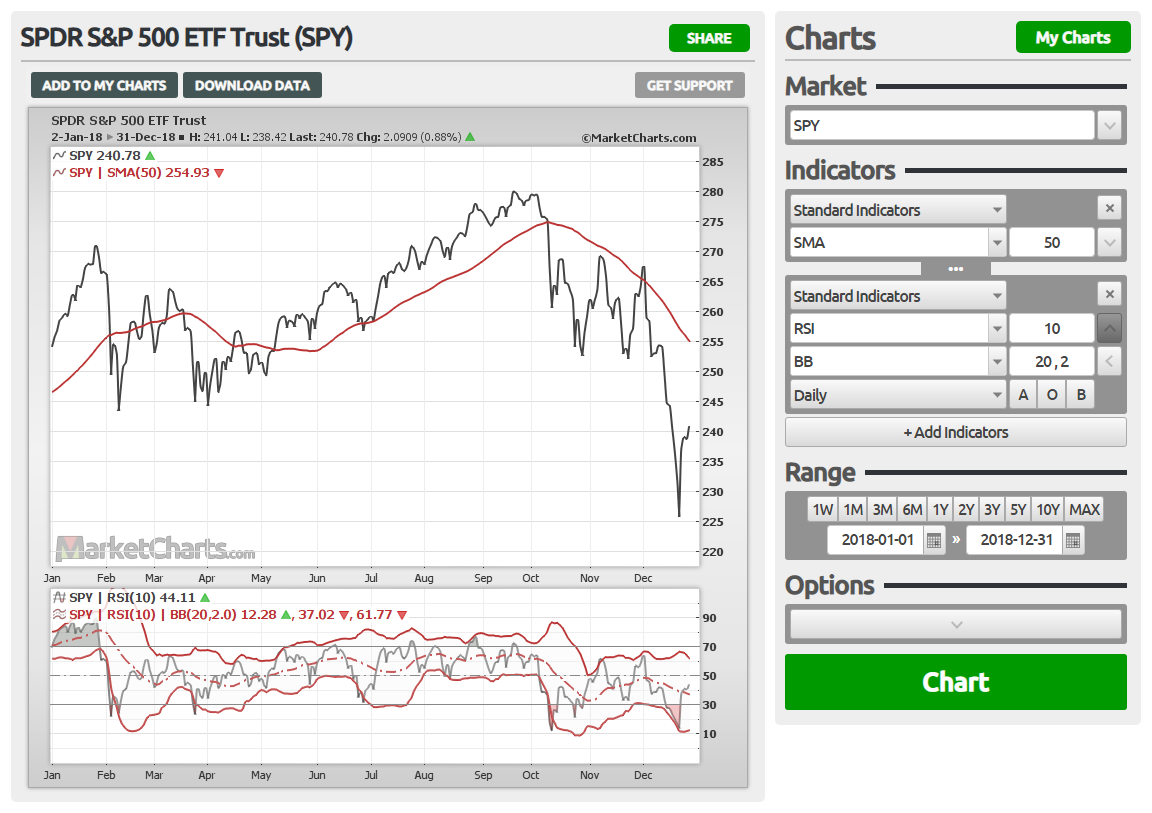
Subindicators can be extremely useful when interpreting indicators or exploring new ways to use those indicators. Simply, subindicators are indicators that are calculated from other indicators. For example, the popular Relative Strength Index (RSI) is generally regarded as low or high if it is below 30 or above 70; however, sometimes there may be a need to interpret it more dynamically by overlaying Bollinger Bands as a subindicator on top of the RSI and use the lower/upper bands instead of the 30/70 levels.
Timeframes
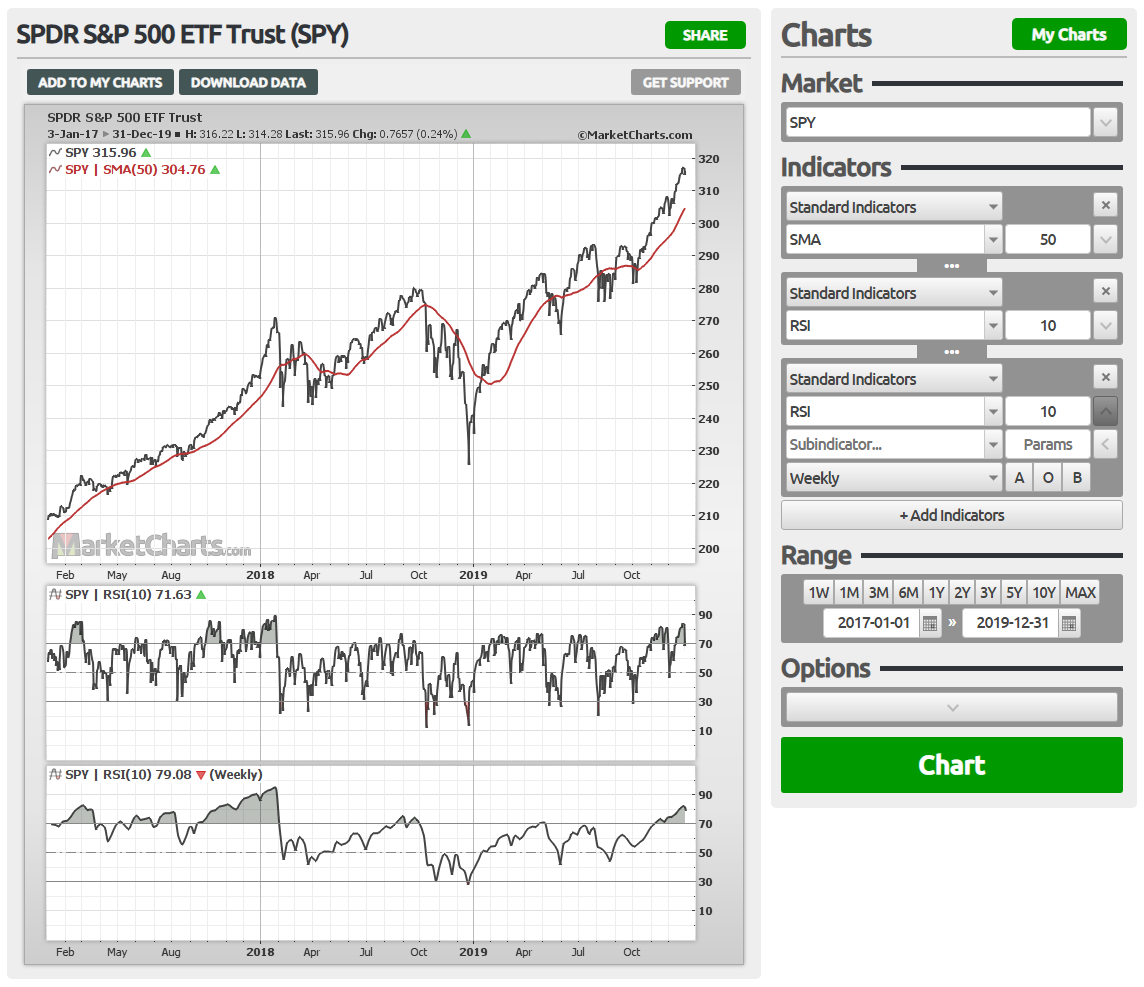
You can easily plot different timeframes on the same chart. For example, plot the daily and weekly RSI on the same chart to easily observe what happens when daily and weekly signals coincide.
Intermarket
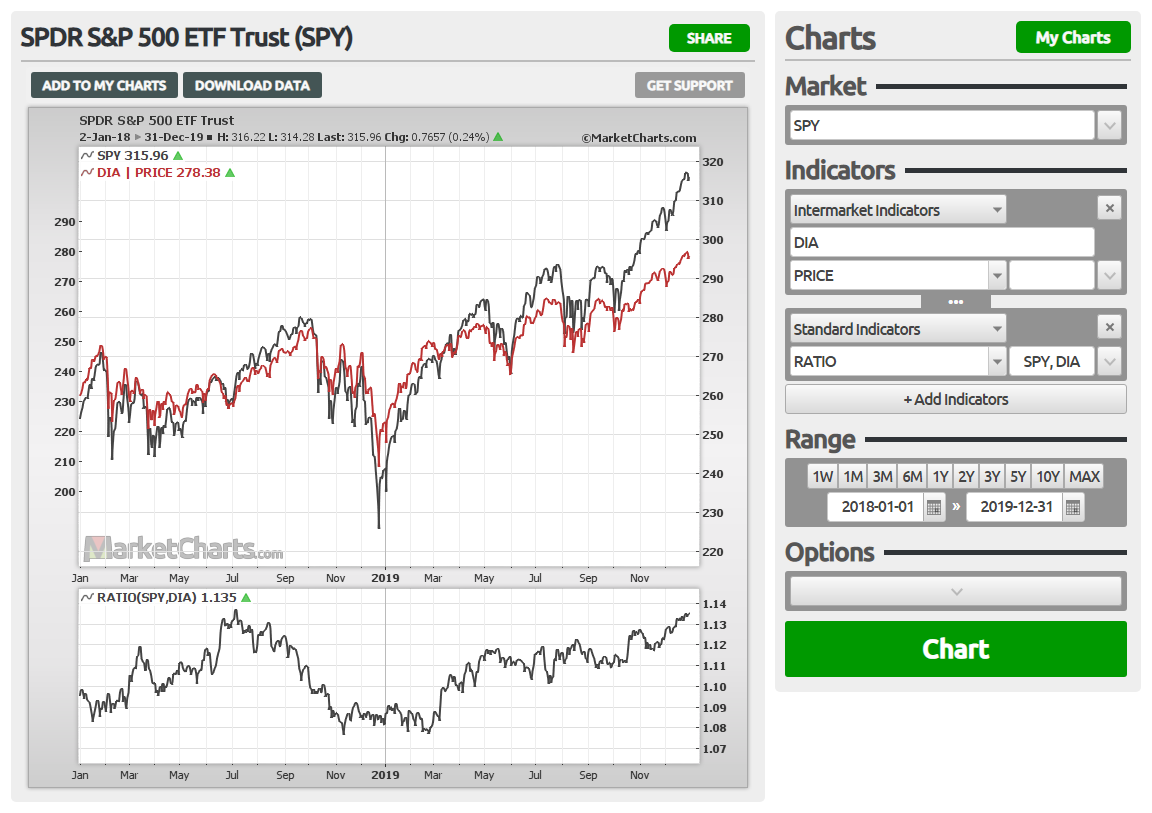
Intermarket relationships are more discoverable visually when different markets and their indicators can be displayed on the same chart with ease.
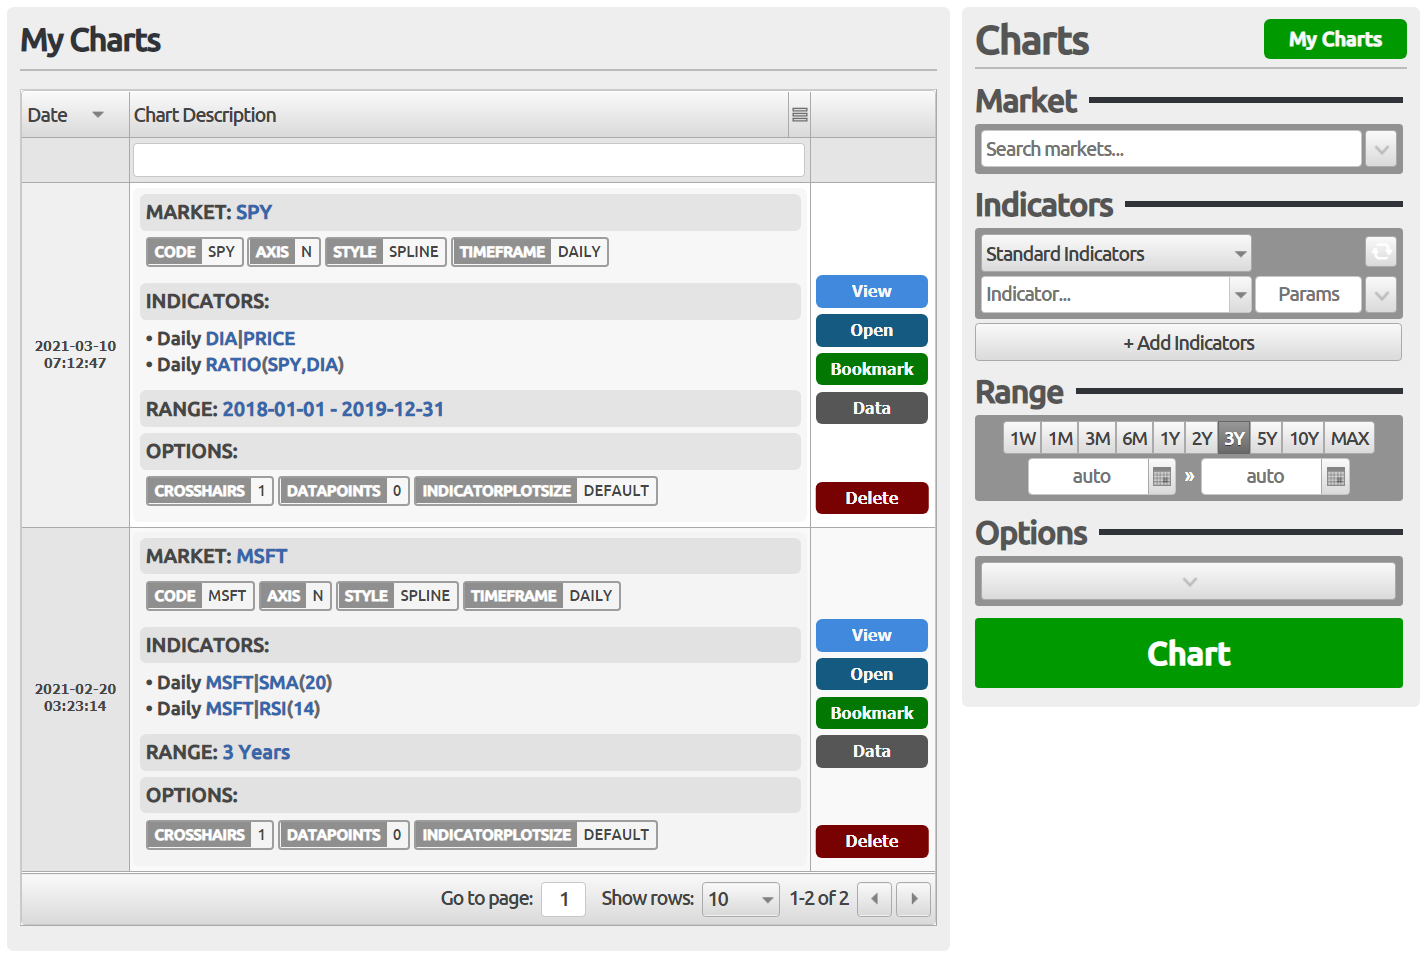
Saved Charts
Charts can be saved so that they can be conveniently requested again. Saved charts are displayed as a searchable table showing the chart specification and options to view the chart either as a popup image or in full on a new page showing the chart and its settings. Additionally, saved charts can also be bookmarked in your browser for direct access without navigating the site.
Examples
Below are some examples of the charts that can be created:
| Charts | Demo |
|---|---|
Basic example: The SPY ETF and its SMA(50) and RSI(10) MARKET: SPY CODESPYTIMEFRAMEDAILY INDICATORS: • Daily SPY | SMA(50) • Daily SPY | RSI(10) RANGE: 2017-01-01 - 2019-12-31 | |
Subindicators: RSI(10) and a subindicator, Bollinger Bands in this case MARKET: SPY CODESPYTIMEFRAMEDAILY INDICATORS: • Daily SPY | RSI(10) | BB(20,2.0) RANGE: 2018-01-01 - 2018-12-31 | |
Mixing timeframes: The daily RSI(10) and the weekly RSI(10) MARKET: SPY CODESPYTIMEFRAMEDAILY INDICATORS: • Daily SPY | RSI(10) • Weekly SPY | RSI(10) RANGE: 2017-01-01 - 2019-12-31 | |
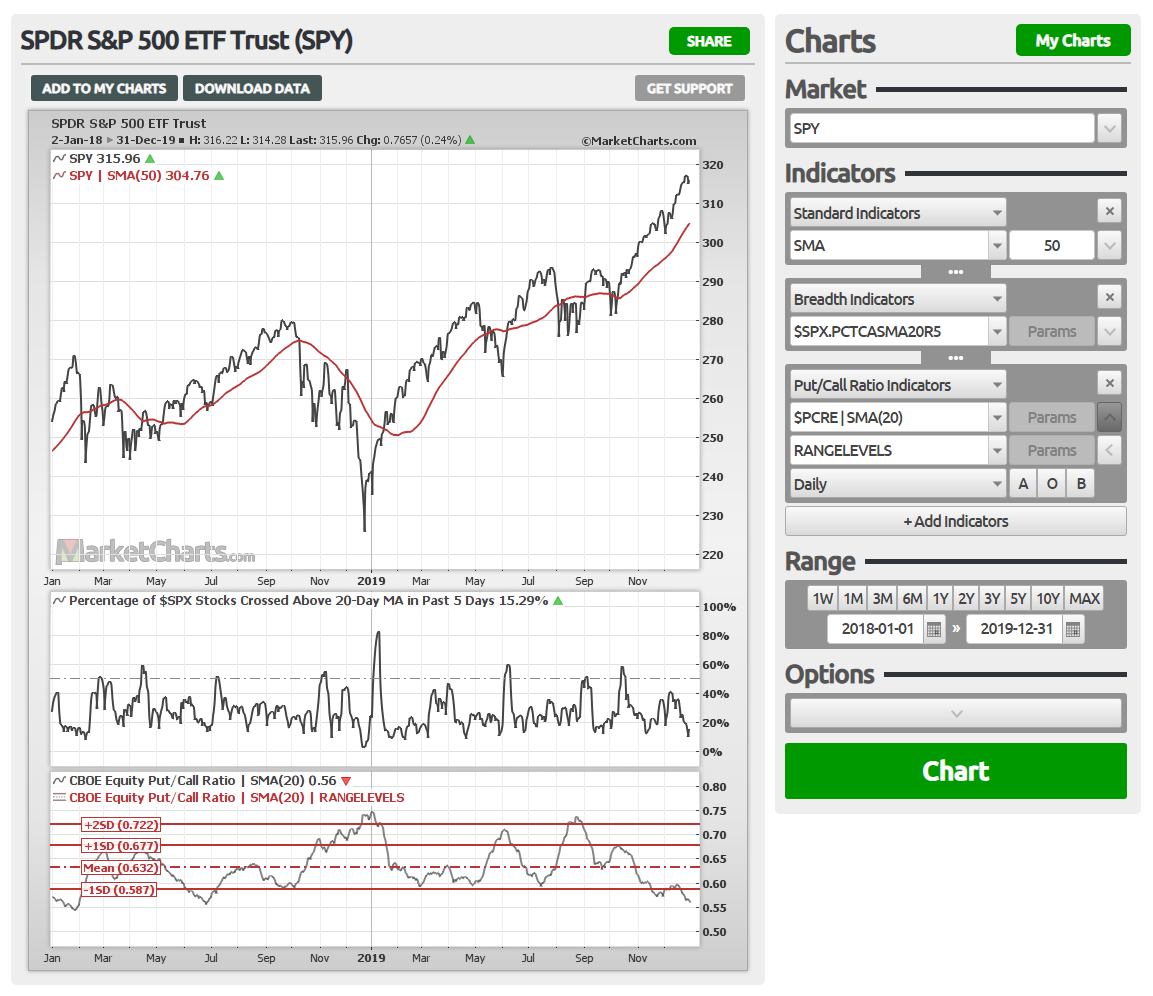
Mixing indicator types: Standard, breadth and put/call ratio MARKET: SPY CODESPYTIMEFRAMEDAILY INDICATORS: • Daily SPY | SMA(20) • Daily $SPX.PCTCASMA20R5 • Daily $PCRE | SMA(20) RANGE: 2017-01-01 - 2019-12-31 |