Effective Tools for Investors and Traders
Find market edges with the web's largest market breadth library.
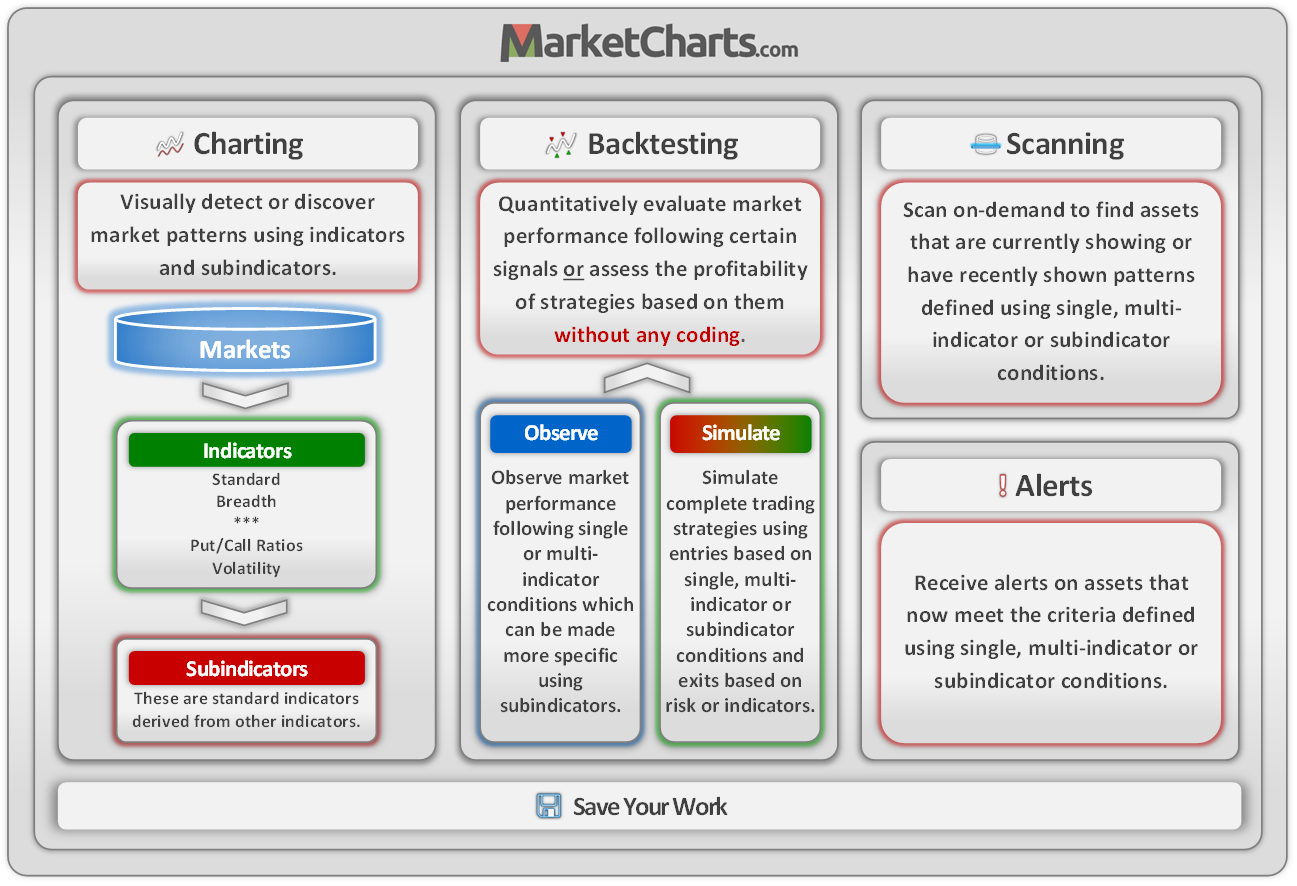
Develop new signals using subindicators, derived from other indicators.
Rapidly backtest your ideas or simulate strategies without any coding.
Find signals with live scanning or get intraday alerts using your criteria.
Subscribe monthly, or yearly to get 2 months free. Cancel online anytime.
Intuitive Charts
Create charts designed to show the interplay between prices, indicators, subindicators and other markets in an easily digestible format.
Indicators & Subindicators
Study prices and broad market dynamics using a huge collection of indicators, then go further by applying subindicators to develop new insights.
Backtesting Without Coding
Quickly backtest an idea or simulate a complete trading strategy without writing any complex code. You can specify single or multiple conditions with AND/OR logic, risk, and many other options.
Scan On-Demand
Scan the entire market for assets that match your criteria, which can be specified using single, multiple indicator or subindicator conditions.
Custom Alerts
Get alerts when your market conditions are observed. Set highly specific alerts using the same multi-condition engine used for backtesting and scanning.
Data Downloads
Download all visible chart data in a spreadsheet-friendly format for use in your preferred applications.
Save Your Work
Save your charts, backtests, scans and alerts in an easily searchable way so you can continue your work right from where you left off.
A Visual and Quantitative Suite of Tools
