Backtesting
The backtesting engine lets you quickly evaluate historical market performance following a signal or assess the profitability of a trading strategy without any coding. Signal criteria can be defined using single, multi-indicator or subindicator conditions and other parameters.
Backtesting
The two modes of backtesting are illustrated with examples below:
- Observation - observe market performance following a signal.
- Simulation (Buy/Sell) - simulate a complete trading strategy.
Observation Mode
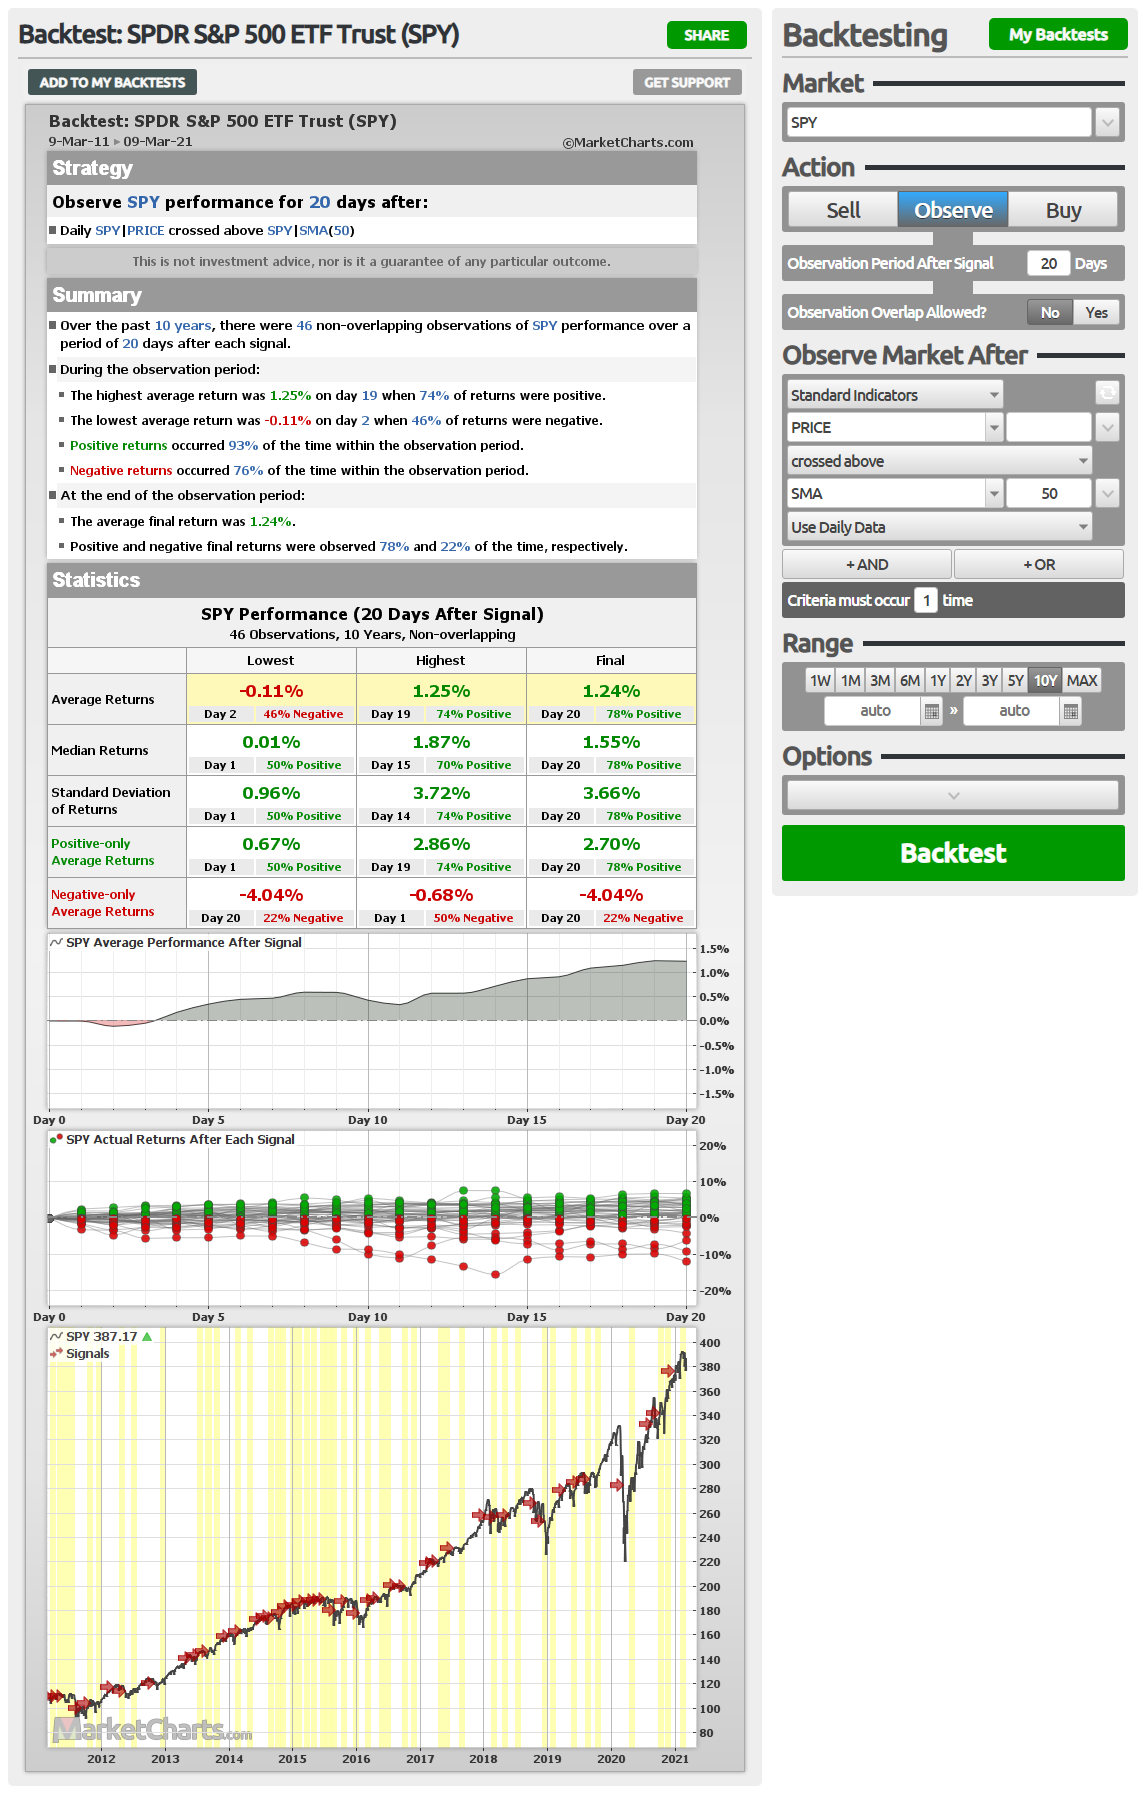
The observation mode can be used when we are mainly interested in the effectiveness of a signal. At a minimum, we need to specify two things; the signal and observation period. A signal can be as simple as a moving average crossover or more complex, involving many indicators, subindicators and other options. The observation period is the amount of time following the signal during which market performance is observed.
Simulation Mode (Buy/Sell)
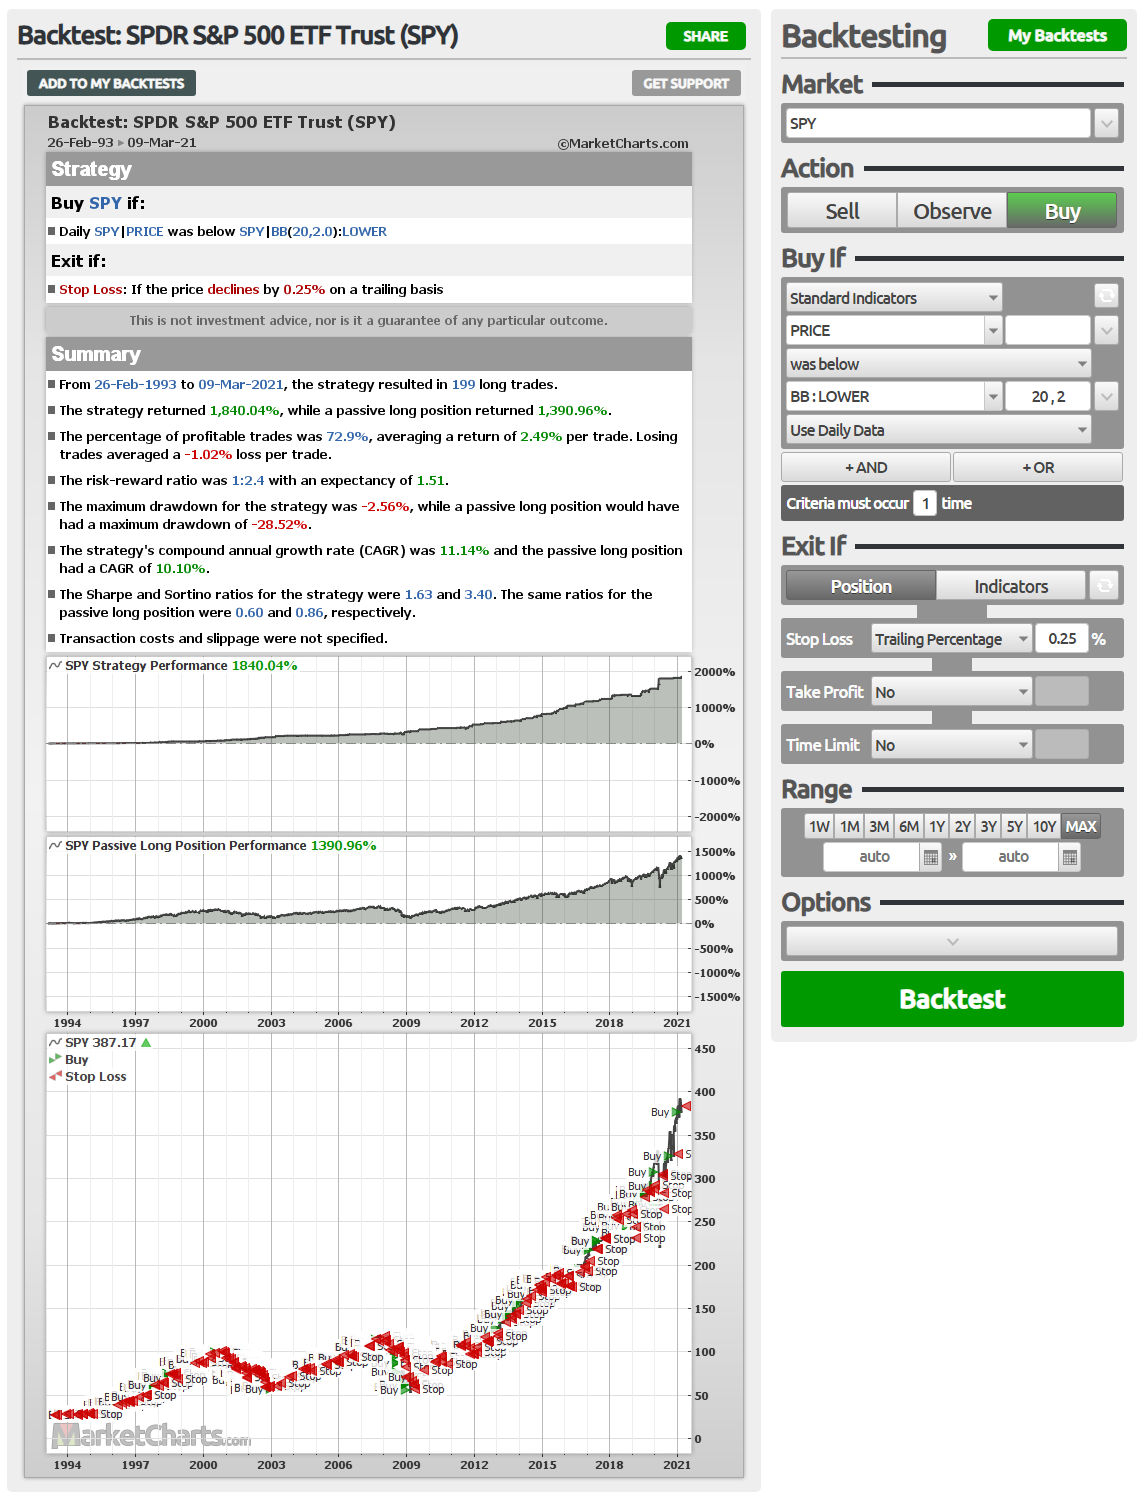
The simulation mode is used to evaluate the historical profitability of a trading strategy. For this, we need to specify an entry condition and an exit condition, which can be based on stop-loss, take-profit, time-limit or indicator signals. Optionally, we can also specify many other parameters, including transaction costs, slippage, starting capital and trade size.
Saved Backtests
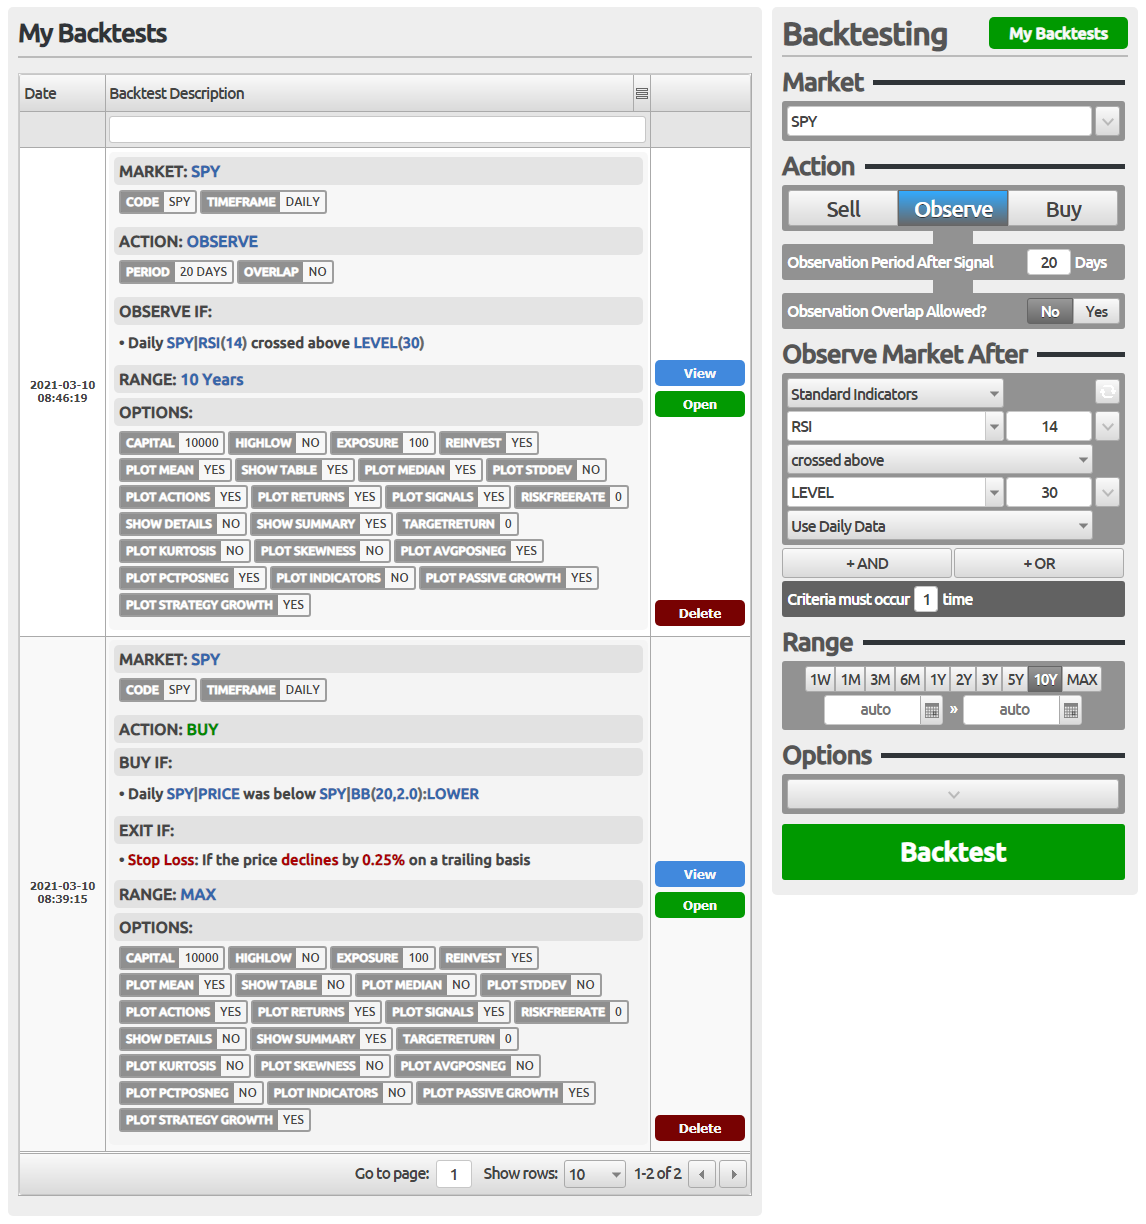
Backtests can be saved so that they can be conveniently requested again. Saved backtests are displayed as a searchable table showing the backtest specification and options to view the results either as a popup image or in full on a new page showing the backtest results and its settings.
Backtesting Examples
Below are several examples of both types of backtests:
| Backtests: Observation | Demo |
|---|---|
What happened during the 20 days after the SPY crossed above its 20-day moving average? MARKET: SPY CODESPYTIMEFRAMEDAILY ACTION: OBSERVE PERIOD20 DAYSOVERLAPNO OBSERVE IF: • Daily SPY | PRICE crossed above SPY | SMA(20) RANGE: 2017-01-01 - 2019-12-31 OPTIONS: SHOW SUMMARYYESSHOW TABLENOSHOW DETAILSYESPLOT INDICATORSYESPLOT MEANYESPLOT MEDIANNOPLOT RETURNSYESPLOT AVGPOSNEGNOPLOT PCTPOSNEGNOPLOT STDDEVNOPLOT SKEWNESSNOPLOT KURTOSISNOPLOT SIGNALSYES | |
What happened during the 20 days after the SPY RSI(10) crossed above the 30 level? MARKET: SPY CODESPYTIMEFRAMEDAILY ACTION: OBSERVE PERIOD20 DAYSOVERLAPNO OBSERVE IF: • Daily SPY | RSI(10) crossed above LEVEL(30) RANGE: 2017-01-01 - 2019-12-31 OPTIONS: SHOW SUMMARYNOSHOW TABLEYESSHOW DETAILSYESPLOT INDICATORSYESPLOT MEANYESPLOT MEDIANNOPLOT RETURNSYESPLOT AVGPOSNEGNOPLOT PCTPOSNEGNOPLOT STDDEVNOPLOT SKEWNESSNOPLOT KURTOSISNOPLOT SIGNALSYES | |
What happened during the 20 days after the SPY crossed above its 20-day moving average AND the moving average had been trending down for 10 days? MARKET: SPY CODESPYTIMEFRAMEDAILY ACTION: OBSERVE PERIOD20 DAYSOVERLAPNO OBSERVE IF: • Daily SPY | PRICE crossed above SPY | SMA(20) AND • Daily SPY | SMA(20) trended down (10-Point Linear Reg.) AND • Indicator conditions must be within 1 day of each other RANGE: 2017-01-01 - 2019-12-31 OPTIONS: SHOW SUMMARYYESSHOW TABLENOSHOW DETAILSYESPLOT INDICATORSYESPLOT MEANYESPLOT MEDIANNOPLOT RETURNSYESPLOT AVGPOSNEGNOPLOT PCTPOSNEGNOPLOT STDDEVNOPLOT SKEWNESSNOPLOT KURTOSISNOPLOT SIGNALSYES |
| Backtests: Simulation (Buy/Sell) | Demo |
|---|---|
How profitable was it to buy the SPY when it crossed above its 20-day moving average and sell with a trailing stop-loss of 0.5% in 2018? MARKET: SPY CODESPYTIMEFRAMEDAILY ACTION: BUY AT THE CURRENT CLOSING PRICE BUY IF: • Daily SPY | PRICE crossed above SPY | SMA(20) EXIT IF: • Stop Loss: If the price declines by 0.5% on a trailing basis RANGE: 2018-01-01 - 2018-12-31 OPTIONS: SHOW SUMMARYYESSHOW TABLENOSHOW DETAILSNOPLOT INDICATORSYESPLOT STRATEGY GROWTHYESPLOT PASSIVE GROWTHYESPLOT ACTIONSYESREINVESTYESHIGHLOWNOCAPITAL10000EXPOSURE100RISKFREERATE0TARGETRETURN0 | |
How profitable was it to buy the SPY when its RSI(5) crossed above 30 and sell when the RSI(5) crossed below 70 in 2018? MARKET: SPY CODESPYTIMEFRAMEDAILY ACTION: BUY AT THE CURRENT CLOSING PRICE BUY IF: • Daily SPY | RSI(5) crossed above LEVEL(30) EXIT IF: • Daily SPY | RSI(5) crossed below LEVEL(70) RANGE: 2018-01-01 - 2018-12-31 OPTIONS: SHOW SUMMARYYESSHOW TABLENOSHOW DETAILSNOPLOT INDICATORSYESPLOT STRATEGY GROWTHYESPLOT PASSIVE GROWTHYESPLOT ACTIONSYESREINVESTYESHIGHLOWNOCAPITAL10000EXPOSURE100RISKFREERATE0TARGETRETURN0 |